

The CPU has a lot to do. It runs animation, pathfinding, behavior trees, physics, Niagara, everything you scripted in blueprints, and much more. If stat unit is telling you that your game is CPU bound, or if you are experiencing hitches, you should first use a profiler to see what the issue is, and then address the most pressing issue first.
Profiling
What we want to do is see a complete list of how much time is spent executing each event. If you want to do this properly you’ll need to make a development build first, but if you’re feeling rebellious you can also do it in the editor or in a debug build (but the data will be distorted by editor-only events). When you have the game running you can call
stat StartFile
stat StopFile
to record all events that are being called. After calling StopFile it will log where it saved the file (normally in Saved/Profiling/UnrealStats/<session_name>). You can read out the file in the session frontend, either by launching it directly from C:\Program Files\Epic Games\UE_5.2\Engine\Binaries\Win64\UnrealFrontend.exe or in the editor by going to Tools > Session Frontend. From the Session Frontend go to Profiler and drag the .uestats file we created from the file explorer into the profiler.
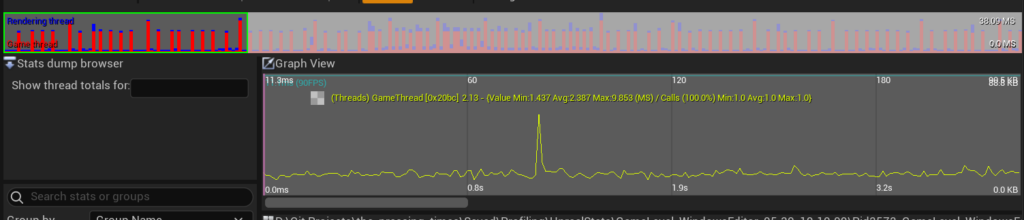
You now see a graph visualizing the frame time over the period you recorded. You can scroll your mouse wheel to amplify the graph — this can help you identify spikes. If you’re looking to solve a hitch you’ll be looking for spikes. You can select a single frame to inspect, or drag over multiple frames to see the average a range. (?)
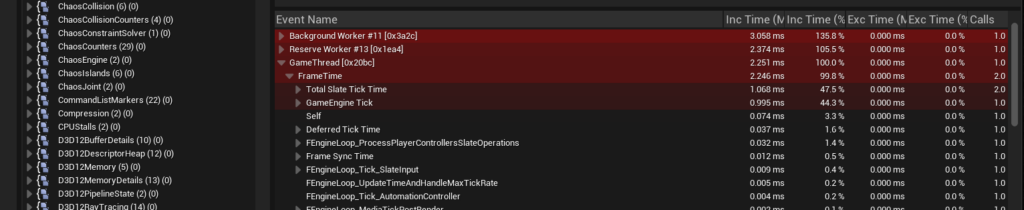
Below the graph is the event call stack of the frame(s). First find the game thread and go down into Frame Time. If the frame is bound by the game thread it will be right below Game Thread. If not, go one step further down to Frame Time > Frame Time. The other branch, FrameTime > Frame Sync Time, is how long the CPU was waiting for the other threads or the GPU to sync up, so the thread was not executing code during that period. Starting from Frame Time you can explore the hierarchy to see what makes the frame take so long. Keep in mind that these functions are not all created by you, so optimization could also mean tweaking engine settings. If you think you know the cause, rinse and repeat to see if it changed anything in the profiler.
I’m not seeing everything?
This process only tracks events. To track your custom C++ code you’ll need to add your own Named Events and Scopes to your code. Sometimes blueprint code is being collected in chunks. To make sure you see all the separate function calls you can run
stat NamedEventsbefore you start recording a stat file in the editor. But keep in mind that this will significantly increase the size of your file.
Tips
Some common strategies to reduce the CPU load in certain situations:
Pooling
Spawning an Actor is a decently expensive operation. If you’re continually spawning and deleting a lot of actors (e.g. bullets) you might take a performance hit because of it. Pooling is a technique where you don’t actually destroy an actor, but “deactivate” and hide it in some way. Then once you want to spawn a new actor of that class, you reactivate it and teleport it to the desired spawning position. The array of deactivated actors is called a pool. One side effect of this approach is that the pool has a limited number of actors. If the player quickly spawns a lot of actors without giving them the chance to “despawn”, they might notice actors disappearing for no good reason.
Events Instead of Tick
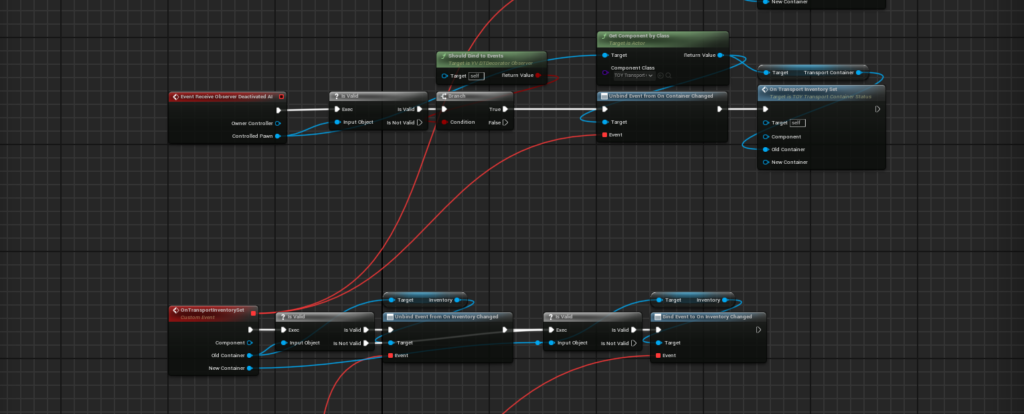
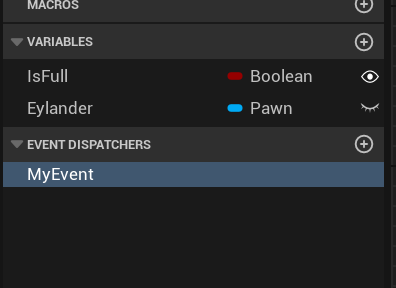
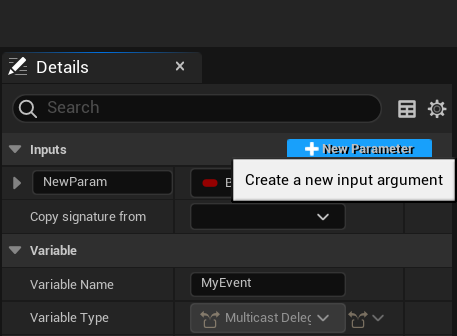
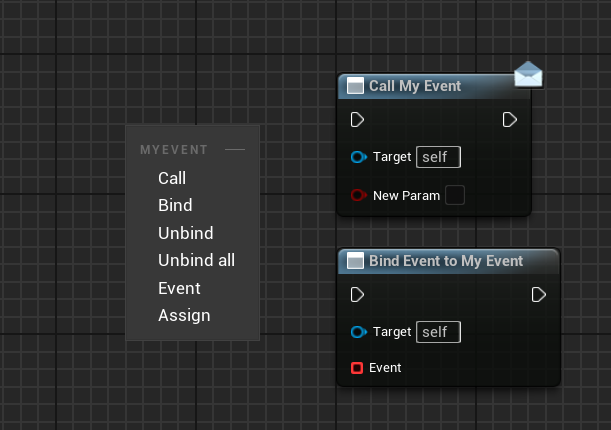
If you don’t know about events, you are probably executing way more code than you need to. Let’s say you need to update the number of lives the player has left in the UI. You could do this by updating the number that is shown in the Tick function, but on the vast majority of ticks the number of lives hasn’t changed. Instead, you can call an event when the number of lives changes, and only update the UI when necessary. This is what the red squares are for in blueprint functions. Many unreal classes come with their own event dispatchers, but you can also make your own:
Disabling Collision
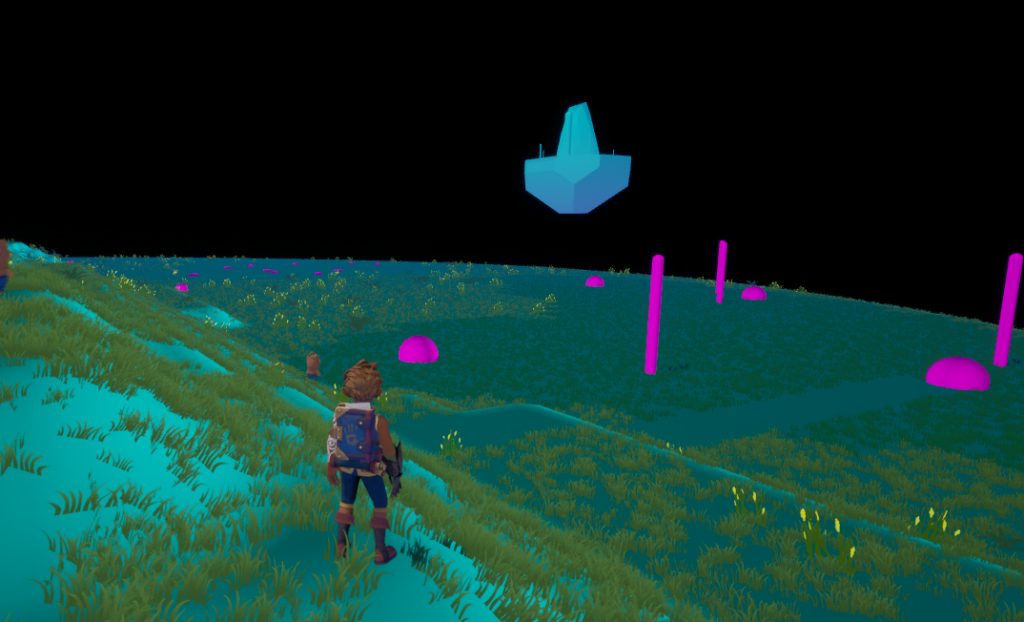
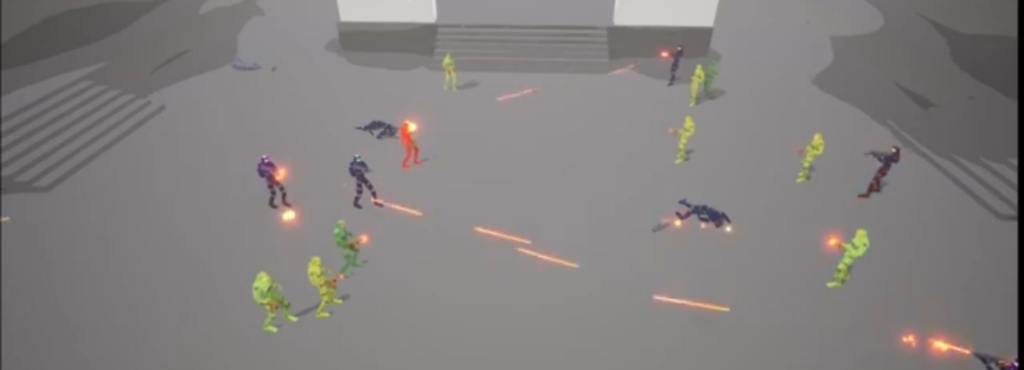
Collision resolution is one of the more expensive operations the CPU has to do. You can reduce the CPU’s load significantly if you only enable collision on objects that need it. Static meshes have their collision enabled by default, so there might be actors out in the distance the player can never touch but have collision enabled nonetheless. In the image above, you can see that the flying island in the distance still has its collision enabled. You can see this using
show CollisionPawn
show CollisionVisibility
show Collision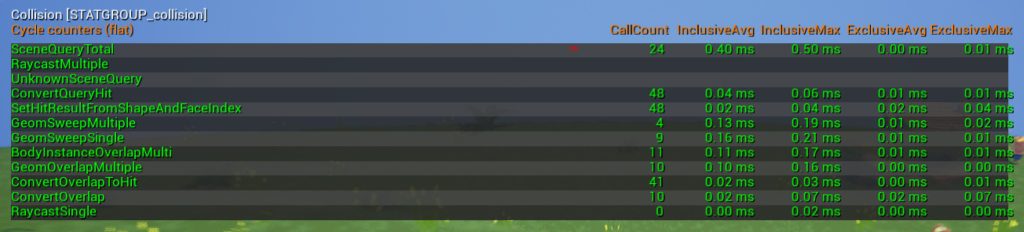
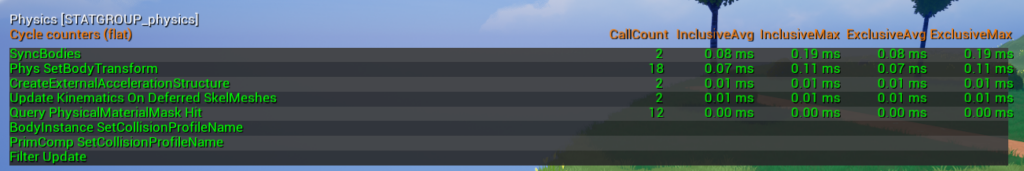
In the images above you can see the results of
stat collision
stat physics
which is another way to see the impact of your colliders.
When adding simple collision to static meshes, there’s a reason you can only use simple shapes. Collision resolution for arbitrary shapes is incredibly expensive compared to that of a box or a sphere. Some level designers get used to setting useComplexCollisionAsSimple on their imported blockout meshes, but make sure you never use this setting in a shipped title. The complex collision (aka using the mesh itself as the collider) will be incredibly expensive and adds a level of detail to the collision resolution that you probably don’t need.
Disabling Tick
You could do a full review of all UObjects that are currently ticking in the game with
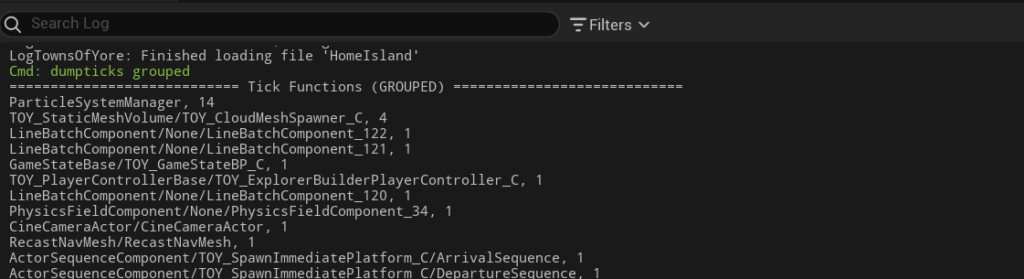
DumpTicks
DumpTicks grouped
This has the benefit of showing all ticking objects, and can therefore help you save CPU time lost by objects that shouldn’t be ticking. The downside is that you have to go to your log file and maybe copy paste it to Google Sheets to make it readable.
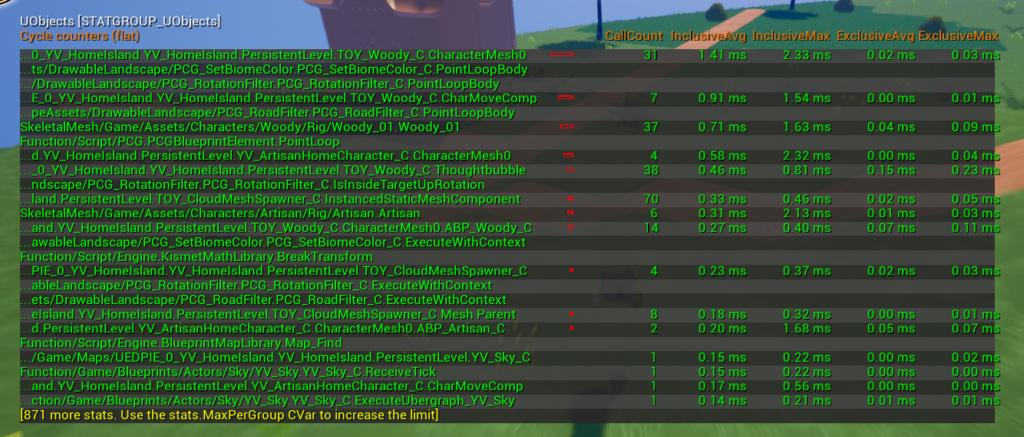
Another option is
stat UObjectswhich shows the objects with the longest tick times on screen. This can help you to quickly identify the few classes with the biggest impact. You probably can’t disable Tick on these classes completely, but you could play with when they are ticking (e.g. using Tom Looman’s significance component).
Other Notes
- Blueprint Nativization was removed in Unreal 5.0. Epic seems to be porting code to C++ manually now for their own projects.