
You might be used to break pointing your C++ in Visual Studio or Rider (aka your IDE). As you might know, this is only possible because your IDE has “attached” itself to the Unreal editor. Usually this happens because you either launch the editor from your IDE, or because you opened your IDE from the editor.
But when a bug only seems to happen in a packaged build you can’t break point your code in an editor build, so you’ll have to attach the packaged game build manually to your IDE.
Attaching a Process
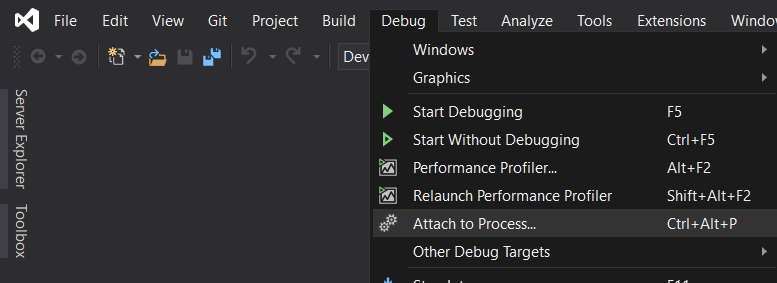
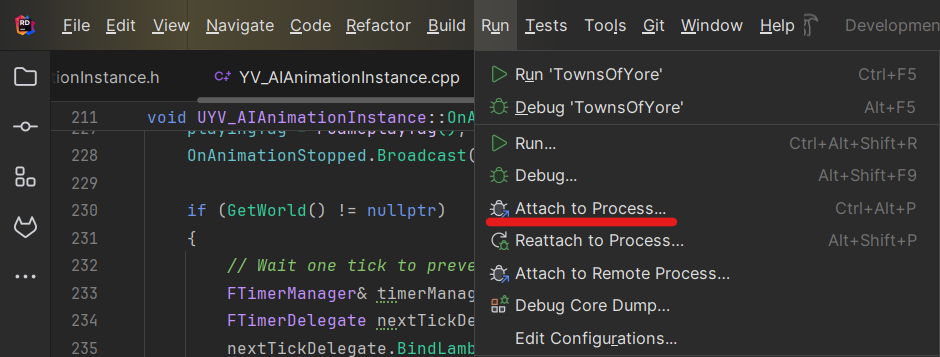
In VS, go to Debug > Attach to Process. In Rider, go to the hamburger menu > Run > Attach to Process. Or just you can use Ctrl+Alt+P on both.
You’ll see a list of all processes your OS is running. You can filter it to find the name of your game. You will likely find 2 processes with the name of your game, a short one (to the .exe) and a longer one (to the Win64 folder). Go for the longer name. When in doubt, you can also open task manager to see which process is using all your system resources and check the process ID.
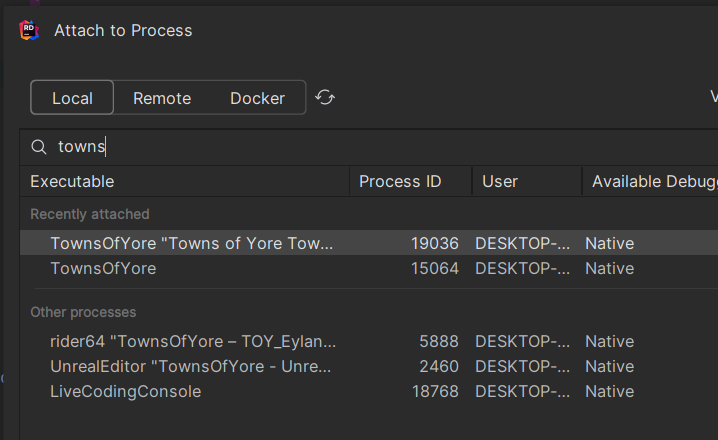
- Make sure you haven’t already attached another process when you try this (e.g. the editor, like in the image above)
- Make sure you don’t have any local C++ changes compared to the packaged build you’re debugging
PDBs
The binaries and executable themselves do not contain info on your variable and function names, so your IDE normally doesn’t know how to find a break point location in machine code based on the location you set in C++. This is what PDB (Program DataBase) files are for. You need PDBs to be able to attach a process to your IDE.
Engine Code
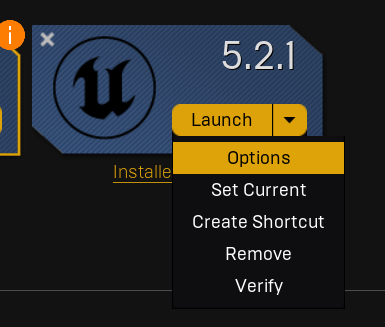
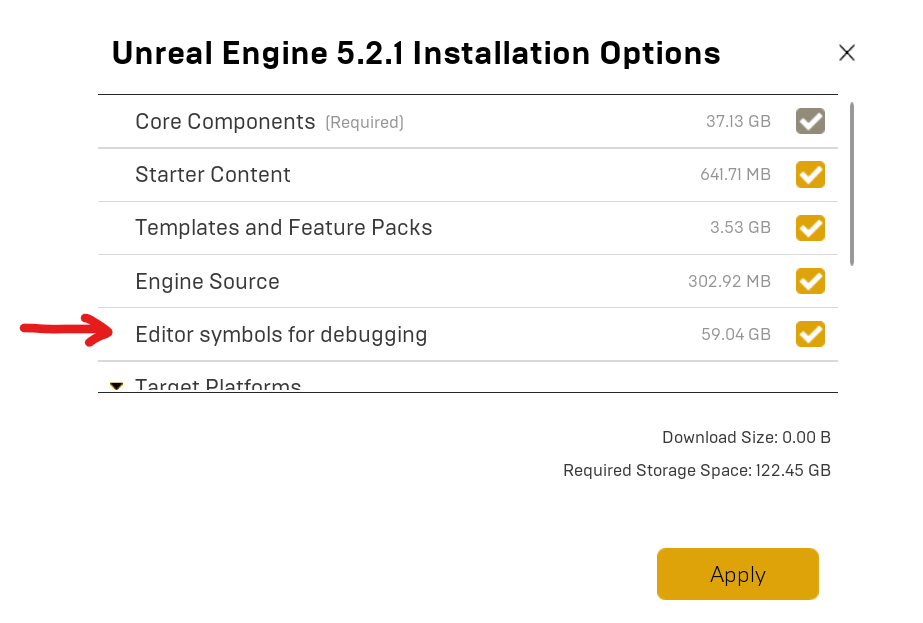
If you want to be able to debug engine code (or see more informative crash reports), you can download the engine PDBs through the epic games launcher. It’s quite a hefty file so it might take a while to download.
Engine Plugins
Plugins that are shipped with the engine are an exception. Their debug files aren’t included in the download. The easiest way to get them working is to copy the folder of the engine plugin and paste it into your project’s Plugins folder. The plugins in that folder take precedence over the engine plugins (and marketplace plugins “installed to engine” through the launcher). This way you can generate the PDBs of the plugin by simply building the game.
Shipping Build

Shipping builds don’t generate PDB files by default (so you don’t accidentally ship your source code). If you are really unlucky and have a shipping-build-only bug you can ask Unreal to make a shipping build with debug files.
Steam
If you’re launching the game through Steam (omg I hope you don’t have a shipping-build-Steam-only bug) you might run into another problem. Uploading your game using Steam Pipe will by default remove the PDBs. The tools/ContentBuilder/scripts/depot_#######.vdf file contains the line
"FileExclusion" "*.pdb"You can remove this from the script all you want, but uploading using the Steam Pipe GUI will just revert it back to the original. To bypass this you can run Steam Pipe in command line from the ContentBuilder folder:
.\builder\steamcmd.exe "+login username password" +run_app_build "..\scripts\app_#######.vdf" +quitIf you don’t have a build server to do this for you, you can pack this command into a powerscript (.ps1) file to quickly execute it.
